..: Updated Daily :..
Euro Area, Eurozone macroeconomic indicators, charts and data series
Sources of the charts : ECB, tradingeconomics.com, MarkIt
Current account balance in selected euro area countries (% of GDP) : the fiscal convergence


Source: data Eurostat, charts Real-World Economic Review; April 2013

Source: EC European Economic Forecast Spring 2012
 source
 source


GDP
GDP in prices, EA-18; data serie updated quarterly
Data serie between 1960 and 2011, in US $, yearly data
Data serie,1995-2014, in euros, updated quaterly
Same data serie, QoQ % change
GDP per capita 1960-2011 (US$)
Real GDP for Greece, Portugal, Ireland and Spain (rhs), Italy (rhs), Iceland (rhs);
Data series since 1995; updated quarterly
CISS systemic financial stress index

Source: ESRB

Government deficit or surplus, as a % of GDP (1999-today)
Updated quarterly, with 2Q lag.
Government Debt, as a % of GDP

Data series since 1970
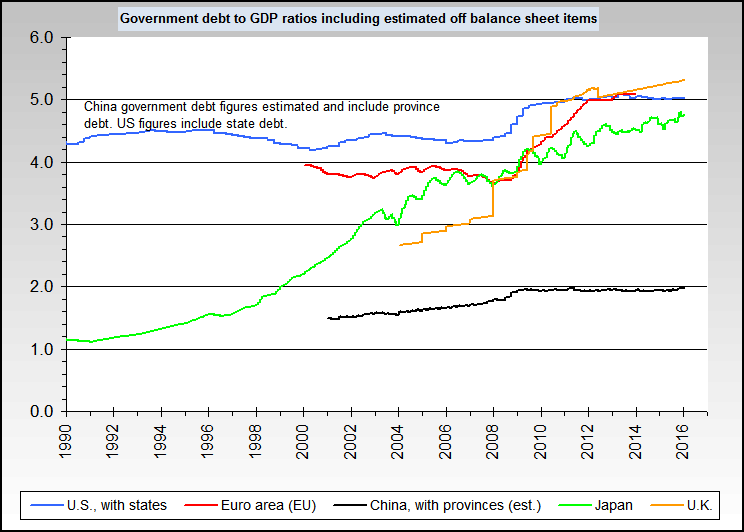
Data series since 1990

Euro area general gov. debt to GDP between 1991 and 2010; yearly data
Euroarea-17 general gov. debt to GDP, 2000-2013; quarterly data
 Euroarea-19 general gov. debt to GDP since 2006; Updated quarterly

Outstanding Domestic Public Debt Securities to GDP for Euro Area till 2011; yearly data
This is the total amount of domestic public debt securities (amounts outstanding) issued in domestic markets as a share of GDP. It covers long-term bonds and notes, treasury bills, commercial paper and other short-term notes.

Outstanding International Public Debt Securities to GDP for Euro Area till 2011; yearly data
Total credit market Debt, as a % of GDP (1995-2012)

Euro Area Government spending, € billion (1995-today)

Euroarea-19; Updated monthly with 2 months lag.

Source: Eurostat, April 2013
Current account balance as % of GDP, Euroarea-19; Updated quarterly since 1999
Updated monthly with 1 month lag.
Data series since 1999
EA-17
EA-19;
Updated quarterly ; includes debt assets and debt liabilities.
EFSF for Euro Area, interest rate

Data serie since 2011
M1, M2, M3 for Euro Area and velocity

Data series since 1970, updated monthly
M3 since 1980, updated monthly
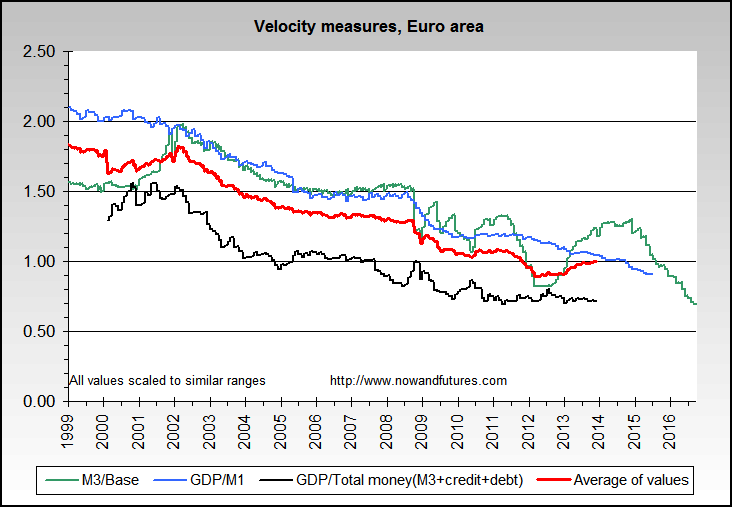
Data series since 1999
US Dollar / Euro exchange rate (1999-today)
Data serie since 1999
Yen / Euro exchange rate
Data serie since 1999
Nominal trade effective exchange rate of the Euro
Euro area-17 countries vis-a-vis the EER-20 group of trading partners (AU, CA, DK, HK, JP, NO, SG, KR, SE, CH, GB, US, BG, CZ, LV, LT, HU, PL, RO and CN) :

Nominal effective exchange rates of the euro, based on weighted averages of bilateral euro exchange rates against 19 trading partners of the euro area; data serie updated daily
Euro area balance of trade (1999-today)

Euro area economic sentiment indicator
Data serie since 1985 with 3 months lag
Economic Sentiment Indicator (ESI) for EU and EuroArea; Data series since 01/1990; updated monthly; Source: EC
Euro area, EU27, Japan, US official unemployment rates

Data serie 2000-2012

Data serie 01/1994 - 07/2013

EA-17; Data serie between 1990 and 12/2013; monthly data
EA-19; data serie since 1998
FOREIGN DIRECT INVESTMENT IN EURO AREA

- see also EU-27 Foreign Direct Investment statistics, and data since 2004

Outward stocks of FDI, EU-27, end 2010
Loans to private sector

Data serie since 1991


Comparison of PMI indexes for Eurozone, US, China, India
between 2009 Q2 and 2012 Q3 :

Capacity Utilization

Data serie since 1985
Industrial Production
In Euro Area, industrial production measures the output of businesses integrated in industrial sector of the economy such as manufacturing, mining, and utilities.

Data serie since 1991
Consumer Confidence (updated monthly, with the maximum duration available)

Data serie since 1985

Data serie since 1972

Data serie since 1991

Data serie since 2004

Data serie since 1982

Data serie since 1997

Data serie since 1988

Data serie since 1987

Data serie since 1996

Data serie since 1985

Data serie since 1996

Data serie since 1997

Data serie since 1996
Others countries, not into Euro Area:

Data serie since 1981

Data serie since 1967

Data serie since 1996

Data serie since 2004

Data serie since 2011

Data serie since 1991

Data serie since 2009
Others indicators
* Statistical Data Warehouse from ECB
* DB Research's interactive maps for world economy 2000-2017, Euroland, Euroland (extended), European banking market
* DB Research's interactive maps for world economy 2000-2017, Euroland, Euroland (extended), European banking market
* Euro zone indicators page on tradingeconomics.com
* Principal Global Indicators
* GFMAG Economic database
* EC European Economic Forecast spring 2013
* GFMAG Economic database
* EC European Economic Forecast spring 2013
* AMECO, the annual macro-economic database of the European Commission's Directorate General for Economic and Financial Affairs
* CMAVision's Sovereign Risk Report, updated quarterly
* CMAVision's Sovereign Risk Report, updated quarterly

Aucun commentaire:
Enregistrer un commentaire