3/25/2014 St Louis FED announced to remove one month later all FRED existing and archived series relative to Dow Jones, S&P500, Case-Shiller indexes. On 4/25/2014, a new press release explains the series will be kept available but include 10 years only of daily history.
Last, but not least, you might be interested in reading how Central banking and haute finance have grown at the expense of the people.
..: Updated Daily :..
Shortcuts to: Main indicators - Citizens confidence - Gold prices - Dollar exchange rates - Industry, retail and corporate financing - Prices and inflation - (UN)employment - Social Crisis - Safety Net - Housing
__________________________
the United States Economic Dashboard
data series and charts

updated quarterly


updated yearly (source)
Credit types

Yearly change rates; 8.5Y moving data serie ; Updated monthly;
Source: nowandfutures.com using Fed, Treasury.gov data;
Citigroup Economic Surprise Index - United States
This index is a daily measure of whether economic data is better or worse than economists’ projections. It is calculated on a three-month rolling basis and weighted for the importance of the indicator.
4Y moving data serie; updated daily
- CESI USD historical charts :

Data serie 2003-2011

CESI USD, CESI EUR, CESI G10, CESI CNY; Data serie 2009-2012
Barron's US bonds confidence index - United States
It is calculated using the best grade bond index divided by intermediate-grade bond index.
data serie since 1975; updated daily
data serie since 1933; updated monthly
- Last values for others bonds indexes (Barclay's...) are also available on this page.
Foreign-owned assets in the United States, excluding financial derivatives (increase/financial inflow (+) ) BOPI-IEAI
BOPI has been replaced by IEAI serie since 2014 Q1; Updated quarterly
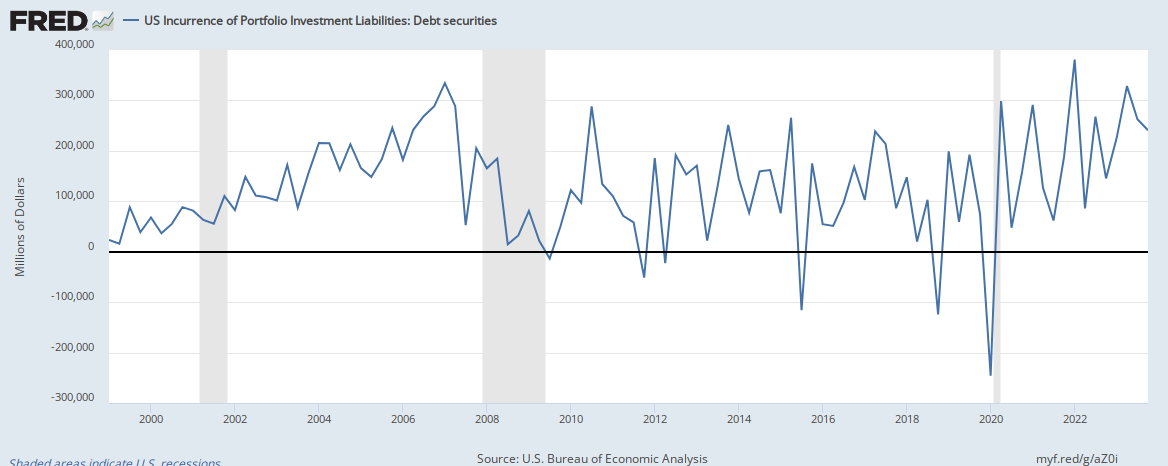
US Incurrence of Portfolio Investment Liabilities: Debt securities (IEAIPID); updated quarterly

Foreign Official assets in the US; quarterly data
(discontinued)
U.S.-owned assets abroad, excluding financial derivatives (increase/financial outflow (-) ) BOPO-IEAA


Net inflow - outflow
U.S. Net Export of Goods and Services

Data serie since 1947, updated quarterly


Institute of Supply Management: Manufacturing PMI Composite (business confidence) index - United States

Data serie since Jan. 1948
- Others ISM indexes.
Conference Board consumer confidence index CCI - United States

Data serie 1966/12 - 2012/04; source: wikimedia
University of Michigan : consumer sentiment - United States

Data serie since 1952
Data serie since 01/1978 ; Updated monthly but with several months lag; Index (Q1 1966=100) ; The 12 most up-to-date monthly values are available from Bloomberg
Comparison between Consumer Sentiment and Personal Consumption (% change); data series since 1952; updated quarterly
Bloomberg U.S. Weekly Consumer Comfort Index

Data serie between 12/1985 and 11/2011 (source)
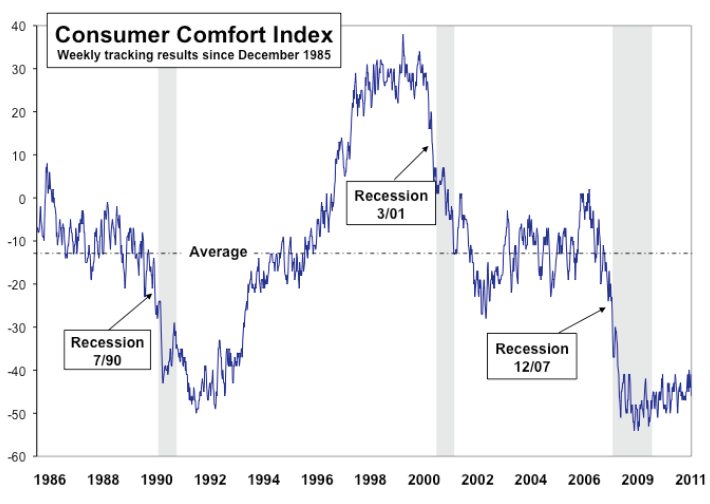
Data serie between 12/1985 and 01/2011 (up-to-date data)
Note from Bloomberg.com :
"The Bloomberg Consumer Comfort Index is based on Americans' ratings of the national economy, the buying climate and their personal finances, reported in a four-week rolling average of 1,000 random-sample telephone interviews of about 250 consumers a week aged 18 or over. The percentage of households with negative views on the economy, personal finances and buying climate is subtracted from the share with positive outlooks and the difference is divided by 3 [???]. The results can range from 100, indicating every participant in the survey had a positive response to all three components, to minus 100, signaling all views were negative. The margin of error is 3 percentage points."


"The Bloomberg Consumer Comfort Index is based on Americans' ratings of the national economy, the buying climate and their personal finances, reported in a four-week rolling average of 1,000 random-sample telephone interviews of about 250 consumers a week aged 18 or over. The percentage of households with negative views on the economy, personal finances and buying climate is subtracted from the share with positive outlooks and the difference is divided by 3 [???]. The results can range from 100, indicating every participant in the survey had a positive response to all three components, to minus 100, signaling all views were negative. The margin of error is 3 percentage points."


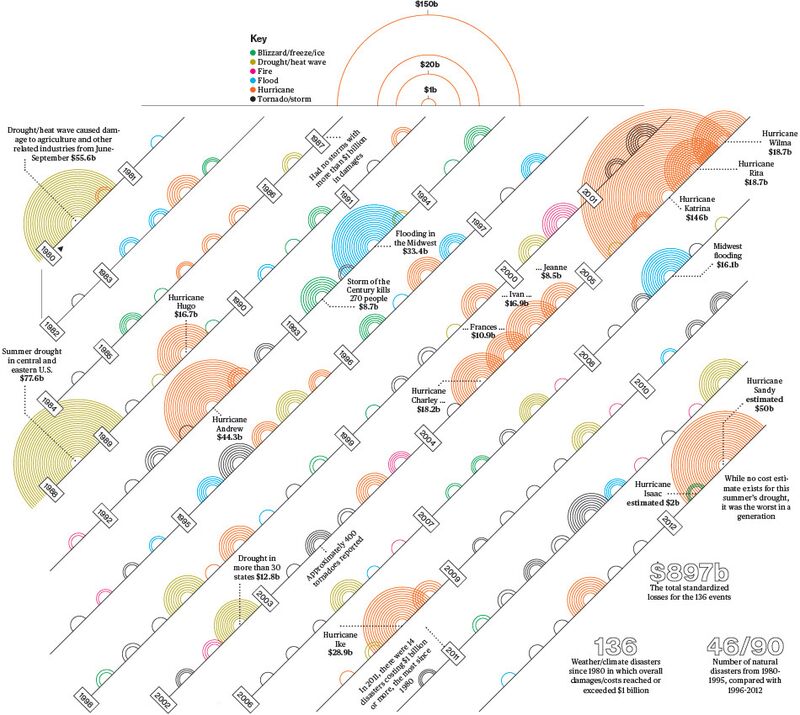
Number and costs of natural disasters
CMI's Absolute Demand Index
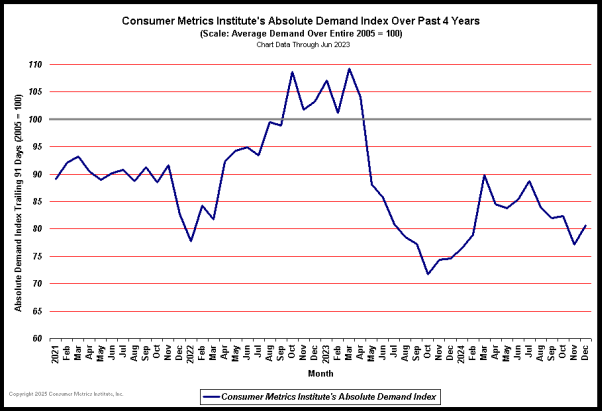
4Y moving data serie; updated monthly
NDR: Differences between this chart before 2011 and the one published by easynomics (data source or used methodologies for the same period of time) are not explained by the authors, making this index not usable for us.
United States Real GDP
Using the classical CPI formula reused by ShadowStats.com :

Data serie 1960-Q2 2012
Velocity
2.2 USD Exchange Rates
US Dollar / Euro exchange rate
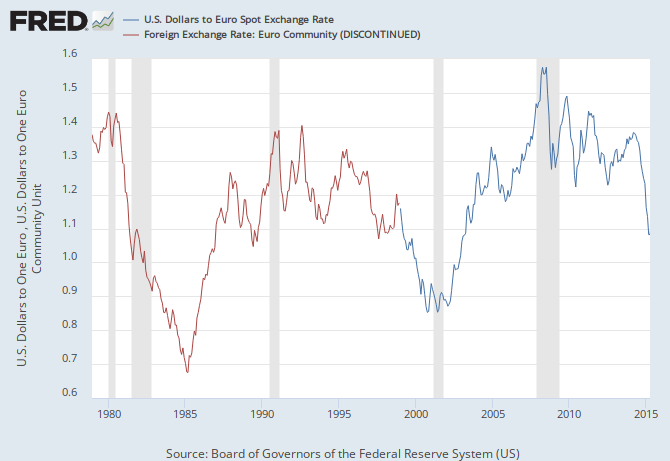

Data serie since 1978; Updated monthly
- see also: ECB data
Yuan / US Dollar exchange rate (1999-today)
Yuan / US Dollar exchange rate (1999-today)
source
Yen / US Dollar exchange rate (1997-today)
Yen / US Dollar exchange rate (1997-today)
Brazilian Real / U.S. Dollar exchange rate (1997-today)
Indian Rupie / U.S. Dollar exchange rate (1997-today)
Russian Ruble / U.S. Dollar exchange rate (2003-today)
South-Africa Rand / U.S. Dollar exchange rate (1997-today)
Real Trade weighted U.S. dollar index : Broad
A weighted average of the foreign exchange value of the U.S. dollar against the currencies of a broad group of major U.S. trading partners : Euro Area, Canada, Japan, Mexico, China, United Kingdom, Taiwan, Korea, Singapore, Hong Kong, Malaysia, Brazil, Switzerland, Thailand, Philippines, Australia, Indonesia, India, Israel, Saudi Arabia, Russia, Sweden, Argentina, Venezuela, Chile and Colombia.

See also Real Trade Weighted U.S. Dollar Index: Major Currencies (TWEXMPA) and Real Trade Weighted U.S. Dollar Index: BRIC countries and other important trading partners (TWEXOPA).
Euro-BRICS basket of currencies / U.S. Dollar exchange rate

Average of YoY rates of change in foreign exchange rates with the US dollar; data series since 1990; updated daily
Russian Ruble is currently not integrated into the formula above (blue line) because Russia / U.S. daily foreign exchange rate data is not available on FRED system.
Aussie Australian Dollar / U.S. Dollar exchange rate (1997-today)
Mexican Peso / U.S. Dollar exchange rate (1997-today)
Canadian Dollar / U.S. Dollar exchange rate (1997-today)
Turkish Lira / U.S. Dollar exchange rate
- chart since 2005
2.3 U.S. Imports of Goods

data series since 1985; updated monthly

data serie since 1919
Industrial total output since 1919 (Barron's); The date chosen for index=100 is different than in the previous chart;
- Note the big difference between the 2 series since 2009 due to a gap in 2010.

- National Reefer Demand and Capacity : Load-to-Truck ratio


updated quarterly

updated quarterly

* Autos, Domestic Units Sold in the U.S. :
* Autos, Imported Units Sold in the U.S. :
* Consumer spending index over civilian employed non-institutionalized 16+ population CE16OV (blue) compared to the same index over the total population (red) :
* U.S. net national savings rate :

data serie 1955-2013
DJ-BTMU US business barometer

* Business sales :
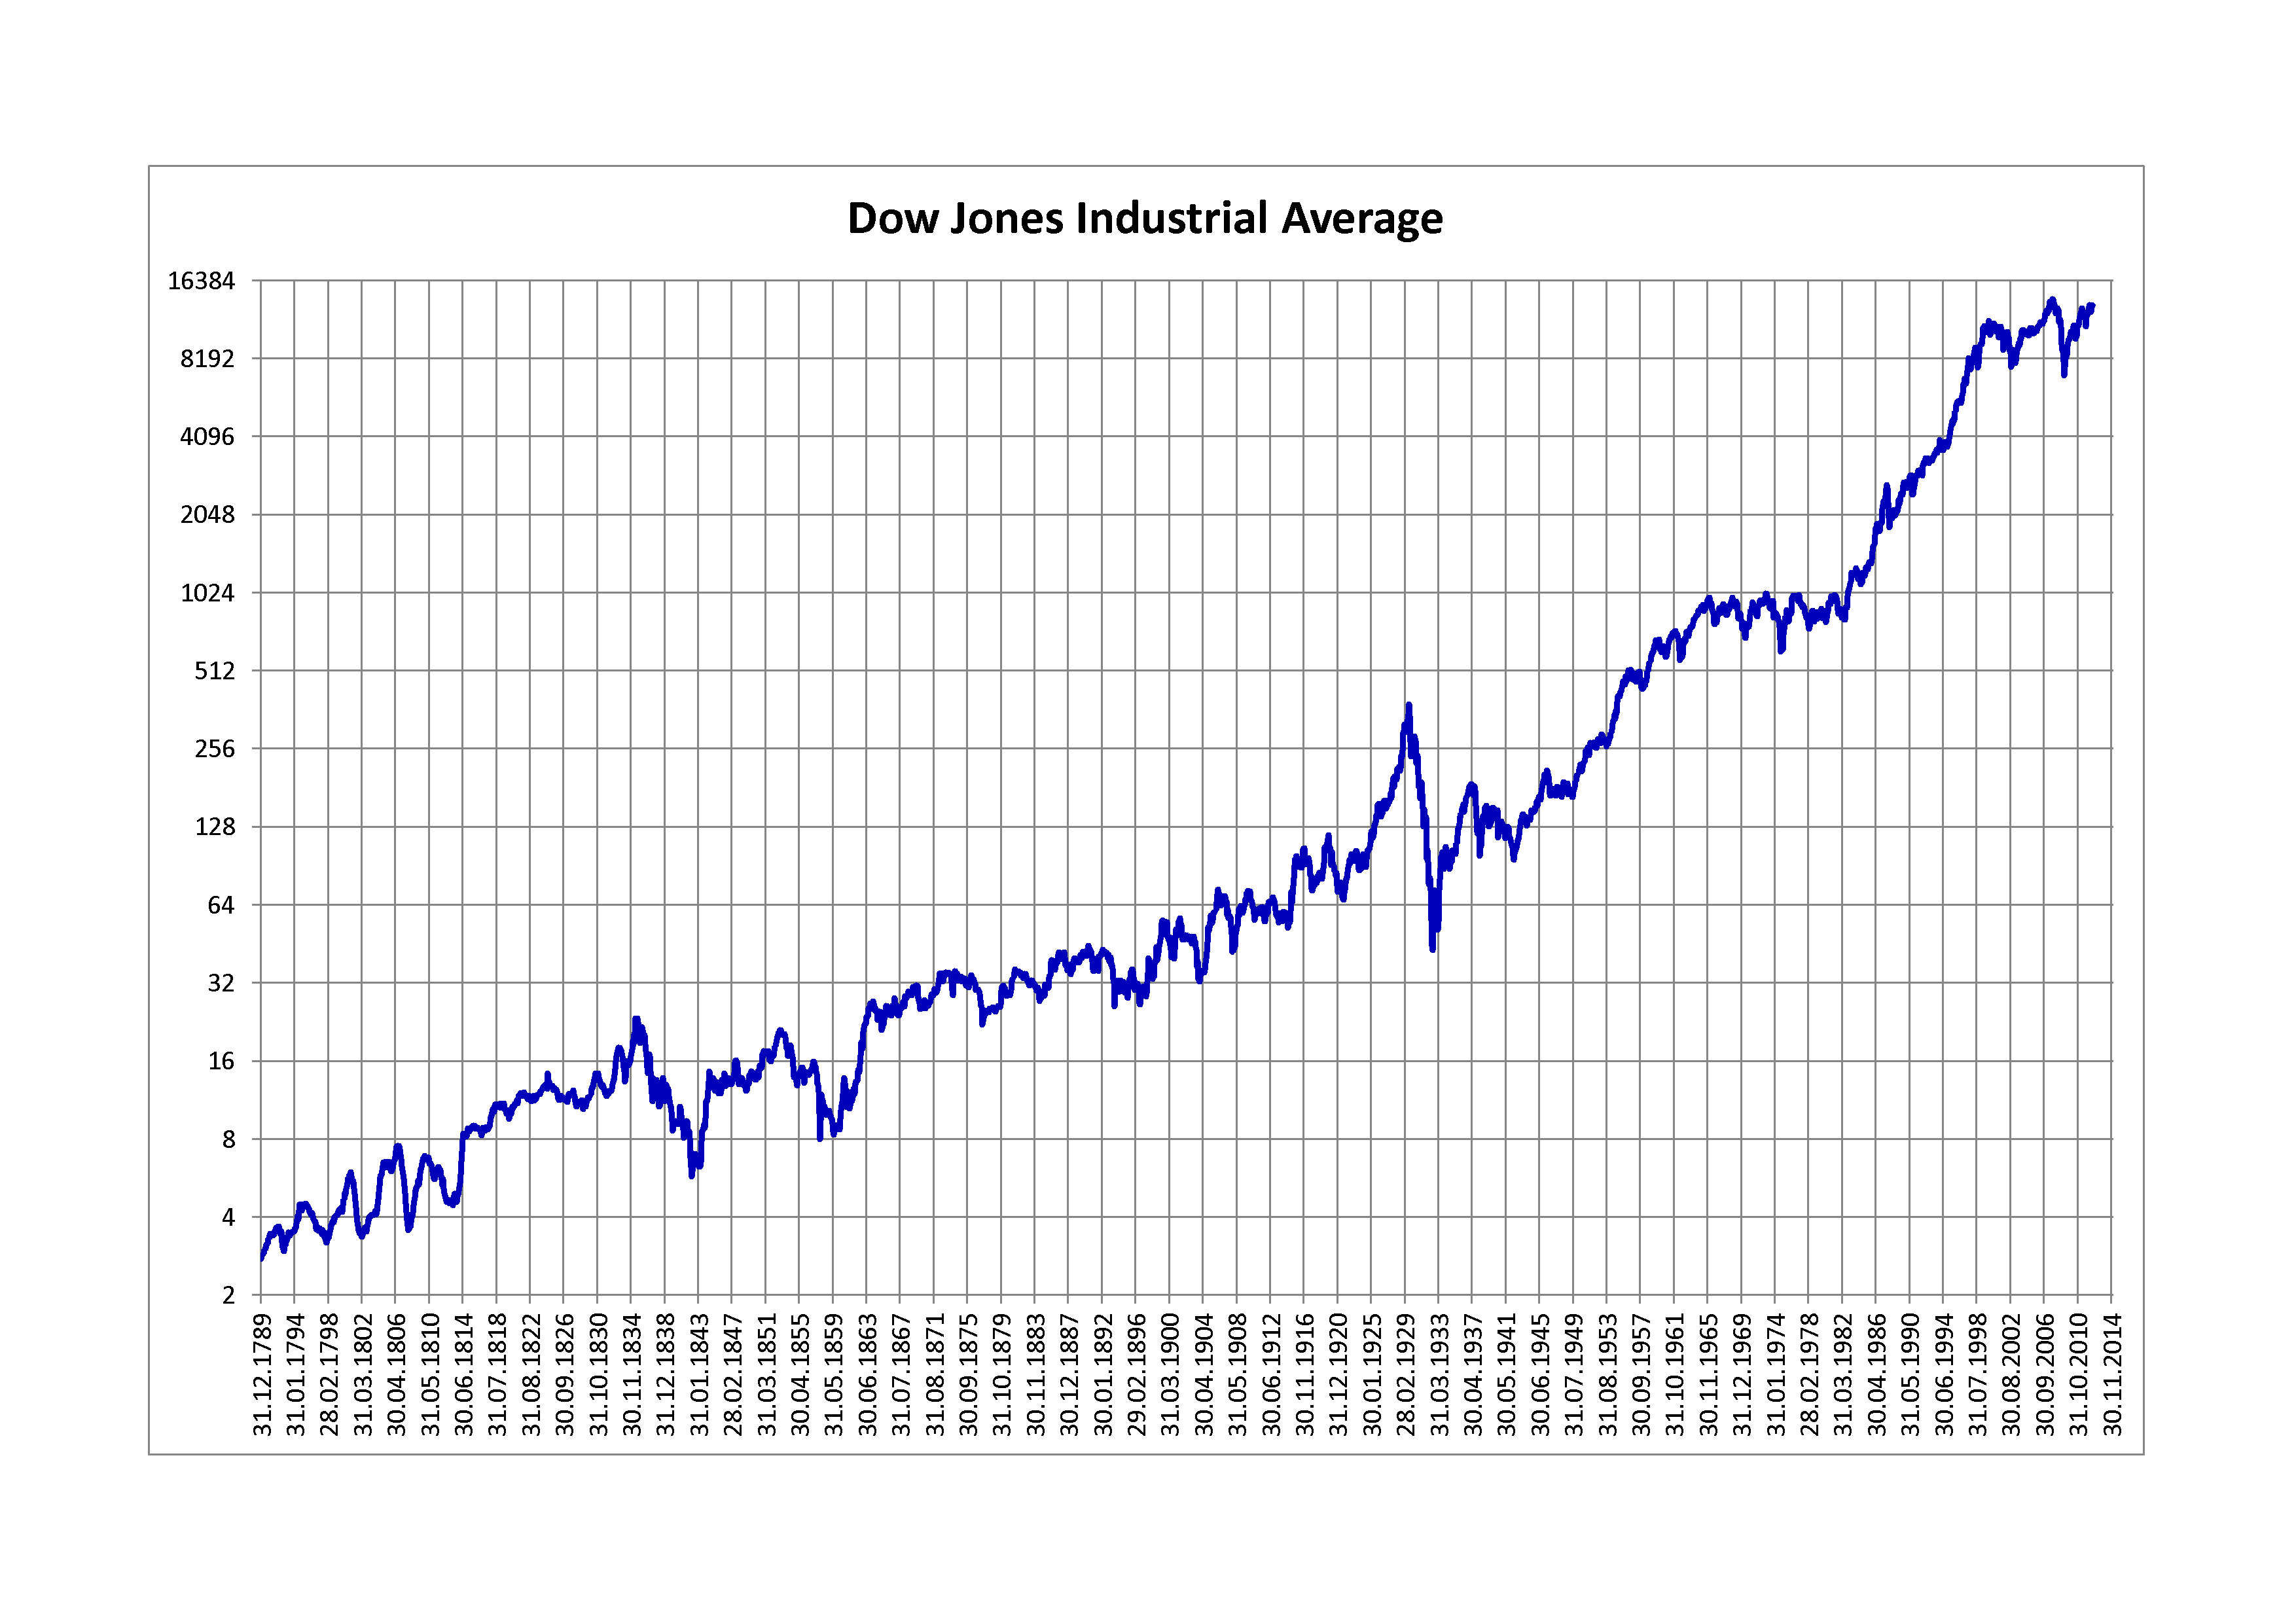
Non-inflation adjusted data; updated monthly


* Comparison of Dow Jones, Nasdaq, S&P500 for the last 9Y, log scale; updated daily ; source
* Comparison of Nikkei, Dow Jones, Nasdaq, S&P500 for the last 9Y, log scale; updated daily ; source

* Traders Index $TRIN RSI 14
TRIN is the Traders Index also referred to as the Arms Index. It's advancers vs decliners divided by the volume of those advancers vs the volume of the decliners. The TRIN spikes when there is fear in the market, it is a ratio that moves inversely to price, in essence.
- 6M moving data serie; Updated daily
- data serie since 2010/07; Updated weekly

data serie 1992-07/2010


Updated weekly

United States Primary Dealer Positions Outright Level Corporate Securities

5Y Data serie till end of May 2012

Moody's Seasoned Aaa U.S. Corporate Bond Yield

(discontinued) source

data series since 04/1971
Barclay's aggregated bond index
All legacy Lehman Brothers benchmark indices were rebranded as Barclays Capital Indices in November 2008.
Flagship benchmarks in the Barclays Indices platform include the Aggregate, Inflation-Linked Bond, High-Yield, Emerging Markets, Municipal, Floating-Rate, Government/Treasury, Universal, and Swaps Index families.
For these families, Barclays publishes both global/multi-currency benchmarks (such as the Global Aggregate) as well as regional/single currency benchmarks (such as the U.S. Aggregate or Euro Aggregate Indices) that are also widely used benchmarks.
CDX IG
The iTraxx Main Europe CDS 5 years is representing 125 entities of investment grade companies and the CDX IG 5 years CDS is the index for U.S. Investment Grade companies.


Data series between 01/01/2008 and 10/08/2012
4. United States CONSUMER PRICES and Inflation
* US Producer Price Index, 10Y Data serie:

US Producer Price Index data by YCharts

* Diesel and Gasoline Prices :

data serie since 1995

data serie since 1990
U.S. and Canada Retail Gasoline Prices; data series, monthly average

Data serie between 01/1976 and 01/2013 + 1Y forecast; monthly average

U.S. total gasoline retail sales since 1983, updated monthly
* Oil Prices :

* Annual inflation or deflation rates, 1666-2004 :


Annual US inflation rate since 1916

5. United States (UN)EMPLOYMENT

* Monthly U.S. full-time jobs over population:


* Civilian Employment (CE16OV) to total population ratio (including militaries overseas), in %
data serie since 1952
Notes :
CE16OV is higher than (PAYEMS = USGOVT + USPRIV)
See also Civilian Employment as defined by OECD
* Civilian Labor Force (thousands)
Includes working teens 16+; excludes kids, military personnel, people in jail.


data serie since 1948;
It can also be calculated with 100-(CE16OV/CLF16OV*100)
* Civilian Employment to civilian labor force ratio, in % (see also on bls.gov) or EMRATIO
Includes working teens 16+ ; excludes kids, military personnel, people in jail.

Civilian Employment-Population Ratio (EMRATIO, above) is the share of the civilian noninstitutional population aged 16+ that is employed.
* Racial effect in Employment-Population Ratio :

* Racial effect in Employment-Population Ratio :
data series since 1954
Civilian Labor Force Participation Rate is the share of the civilian noninstitutional population aged 16+ that is in the labor force i.e. (employed) or (unemployed and looking for work) or (unemployed and not looking for work).
It does not include :
- kids under the age of 16 (but it includes working teens 16+)
- people in jail or others institutions
- military personnel (in active duty)

* 'Civilian Unemployed and Looking Ratio' is the share of the civilian noninstitutionalized population aged 16+ that is unemployed and looking for work :
* 'Civilian Unemployed and not Looking Ratio' is the share of the civilian noninstitutionalized population aged 16+ that is unemployed and not looking for work :
* Distribution of wage earners by level of net annual compensation
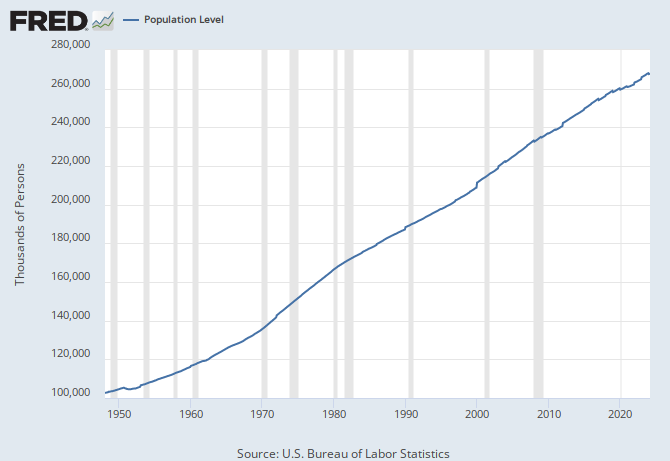
* Working-Age Population as defined for U.S. = Total Noninstitutionalized Civilian Population
Includes working teens 16 years old and over; excludes kids, military personnel, people in jail.

* Civilian noninstitutionalized population, by age :

Note: CNP16OV can also be calculated from previous series.
* Total Institutionalized population (under 16; in jail; under active duty in Armed Forces; older persons) :

* Fed announced coming revision of Puerto Rico labor data by the BLS :

* Puerto Rico labor force: source
* Puerto Rico labor force unemployment rate: source

* CHILDREN AS A PERCENTAGE OF THE POPULATION, 1950-2050


* Evolution of total employees in Temporary Help Services (TEMPHELPS), Construction (USCONS), Information Services (USINFO), Others Services (USSERV)

* Evolution of Total employees in Good-producing industries (USGOOD), Financial Services (USFIRE), Temporary Help Services (TEMPHELPS), and for Government (USGOVT)

* Evolution of % of Total employees in Good-producing industries (USGOOD), Financial Services (USFIRE), Trade/Transportation/Utilities (USTPU), Leisure and Hospitality (USLAH), Mining and Logging (USMINE), Education/Health (USEHS), and for Government (USGOVT), Professional and Business Services (USPBS), over the total of nonfarm employees (PAYEMS)

* Evolution of total employees in Federal, States and local governments:

* Evolution of manufacturing employment as a % of total employment; Data serie between 1939 and May 2011 :


Living veterans who have served in all wars, operations or peacetime
* Veteran population to total noninstitutionalized population ratio, in %

Age 16+; excluding armed forces population and people in jail; data serie since 2006
6.1 SOCIAL CRISIS in the United States


source ; (add Lower and Lower middle results to find the same chart as above)
* Fleeing Americans: Expatriations of US citizens and long term residents:

* Pain & Misery Index :

* U.S. Internet user's search trends (compared requests) :
- gold/silver topic,
- unemployment topic,
- food stamps and protest topic
- firearms topic :


* The 1% and the others 99% : incomes and tax rates


Incomes with scale indexed to inflation
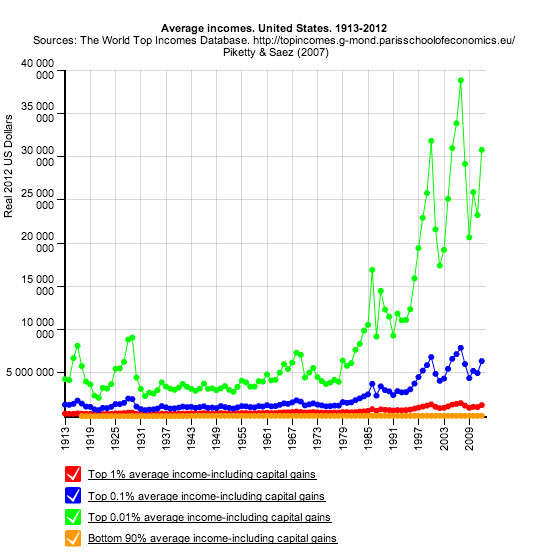
Real incomes (2012 US$); source


/cdn1.vox-cdn.com/uploads/chorus_asset/file/1400916/BuX2fpzIAAAZc77.0.0.jpg)


* Population receiving food stamps :
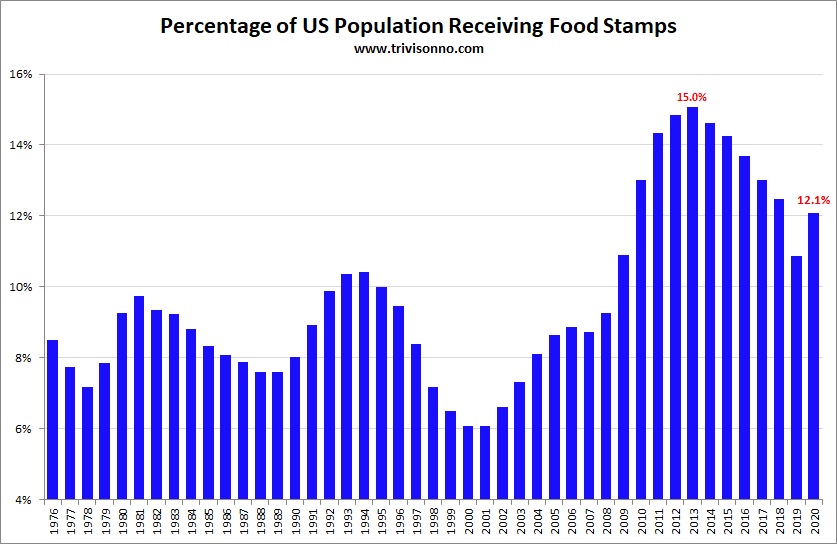
Annual data serie since 1976
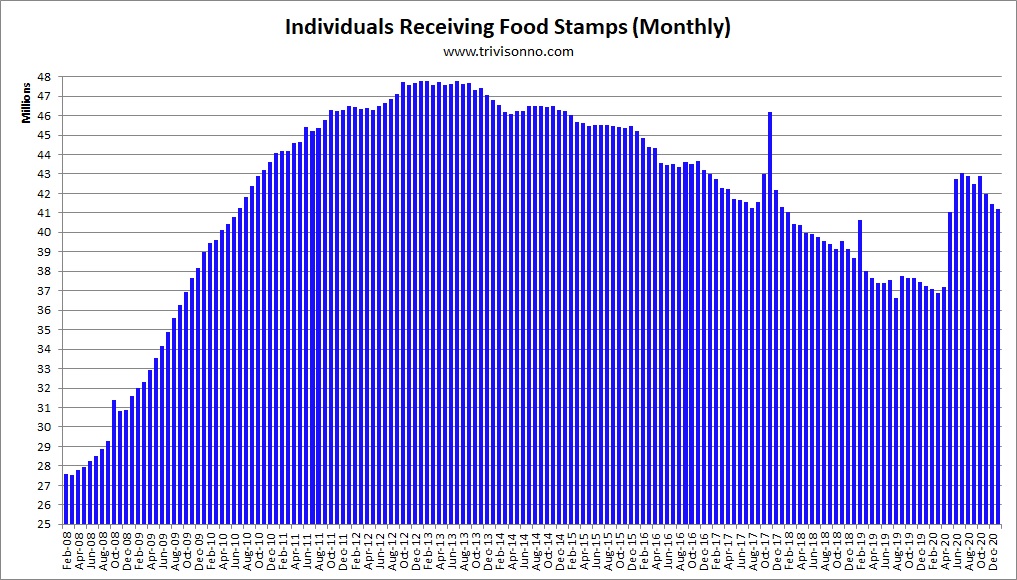
The USDA reports monthly food-stamp data with a two-month delay; Source

Food Stamps: number of participating households and benefit per household; Source


Monthly food stamp enrollment over time and by state since 1990; Interactive map
* Percentage of U.S. Households with Children in Extreme Poverty(< $2 per person, per day), 1996-2011


data serie since 1947, updated quarterly


The correctional population consists of adults in prison, in jail, on probation and on parole.
* Murder in America : interactive database with data since 2000, except for Florida (does not work with Chrome browser).
* With 23% of all people in jail in the world in 2010, and half of them being afro-americans, make the United States the most repressive country in the world. The number of inmates increased more than 20 times the population between 1920 and 2006. There are now more people under “correctional supervision” in America —more than six million— than were in the Gulag Archipelago under Stalin at its height.


* Real Personal Consumption over Real GDP (%, rhs):

data series since 1929; updated monthly

data series since 1959; updated quarterly

6.2 United States Safety Net
* The Geography of U.S. Government Benefits : Animation of the share of Americans’ income that comes from government benefit programs, like Medicare, Medicaid and Social Security, data serie 1969-2009.


Source : NY Times
* CPI for Medical Care, College Tuitions, Textbooks :

* Hours Worked on Minimum Wage in Order to Pay for 1 University Credit Hour: chart since 1980
* Personal current transfer receipts = sum of government social benefits and net current transfer receipts from business

* Hours Worked on Minimum Wage in Order to Pay for 1 University Credit Hour: chart since 1980
* Personal current transfer receipts = sum of government social benefits and net current transfer receipts from business

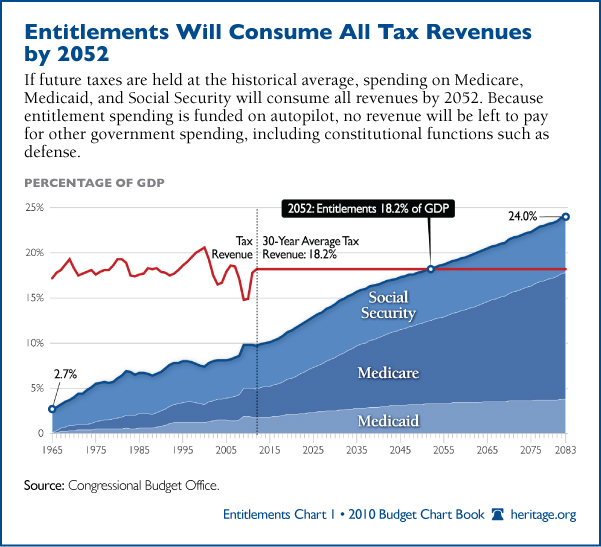
* Entitlements will equal all tax revenues by 2052 :
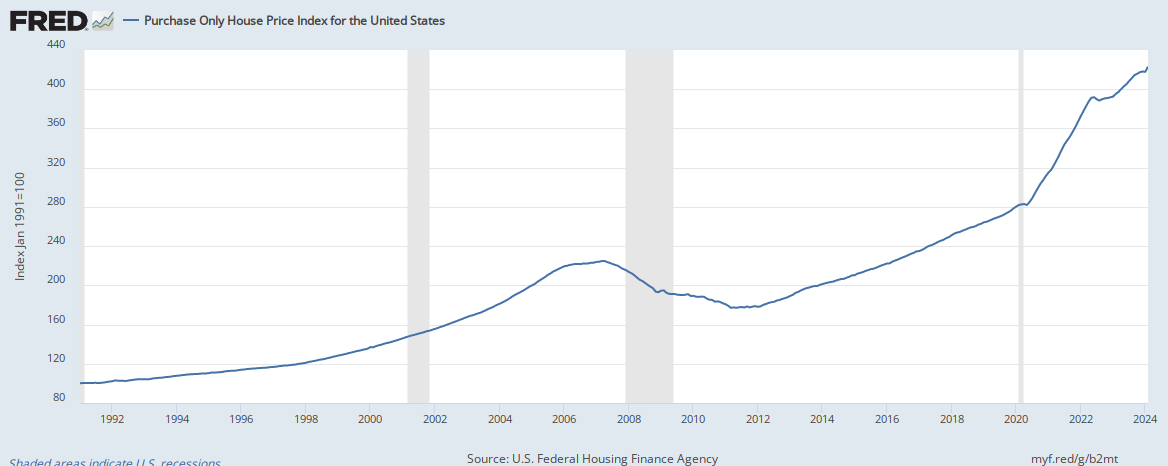
7. United States HOUSING

* MBA Purchase applications index :


* New home sales :

Real Home Prices Index with CPI correction,
1890-2012 Q3 (updated quarterly by Shiller)
and Yearly Real Building Costs Index with CPI correction, 1890-2010
The 2012 Q1 and Q2 index levels are down back to the 1998-1999 recorded levels.

Inflation adjusted US Real Estate Index since 1900
* Case-Shiller Nominal Home Price Index, 1890-2011 :


(discontinued)
The S&P/Case-Shiller Home Price Indices are calculated monthly using a three-month moving average. Index levels are published with a two-month lag. The S&P/Case-Shiller U.S. National Home Price Index is calculated quarterly and levels are published in February, May, August, and November, also with a two-month lag. Index performance is based on non-seasonally adjusted data.

* S&P/Case-Shiller indices, % change from year ago, 1988-2012


* Interactive U.S. Foreclosure Rate Heat Map and foreclosure filings:


* Cook County Housing market statistics by Institute for Housing Studies
* Mortgages delinquency rate :

* Mortgages delinquency rate :
data serie since 1990; updated quarterly
Jacques Attali résume en peu de mots la situation des US dans son billet du 11 février. Il aurait simplement pu citer ses sources ;)
RépondreSupprimer